India is forecast to grow 6.5% in FY 2024-25 while the euro area expands just 0.9%, sharpening a growth spread that is already steering capital, factories and talent toward the world’s most populous democracy and away from a tax-heavy, energy-costly Europe.
The divergence forces boards and portfolio managers to reprice risk and return: Europe offers stability but stagnation, India layers higher volatility on top of outsized upside. The key questions now are whether Europe can cut its cost base fast enough and how long India can sustain breakneck expansion without overheating.
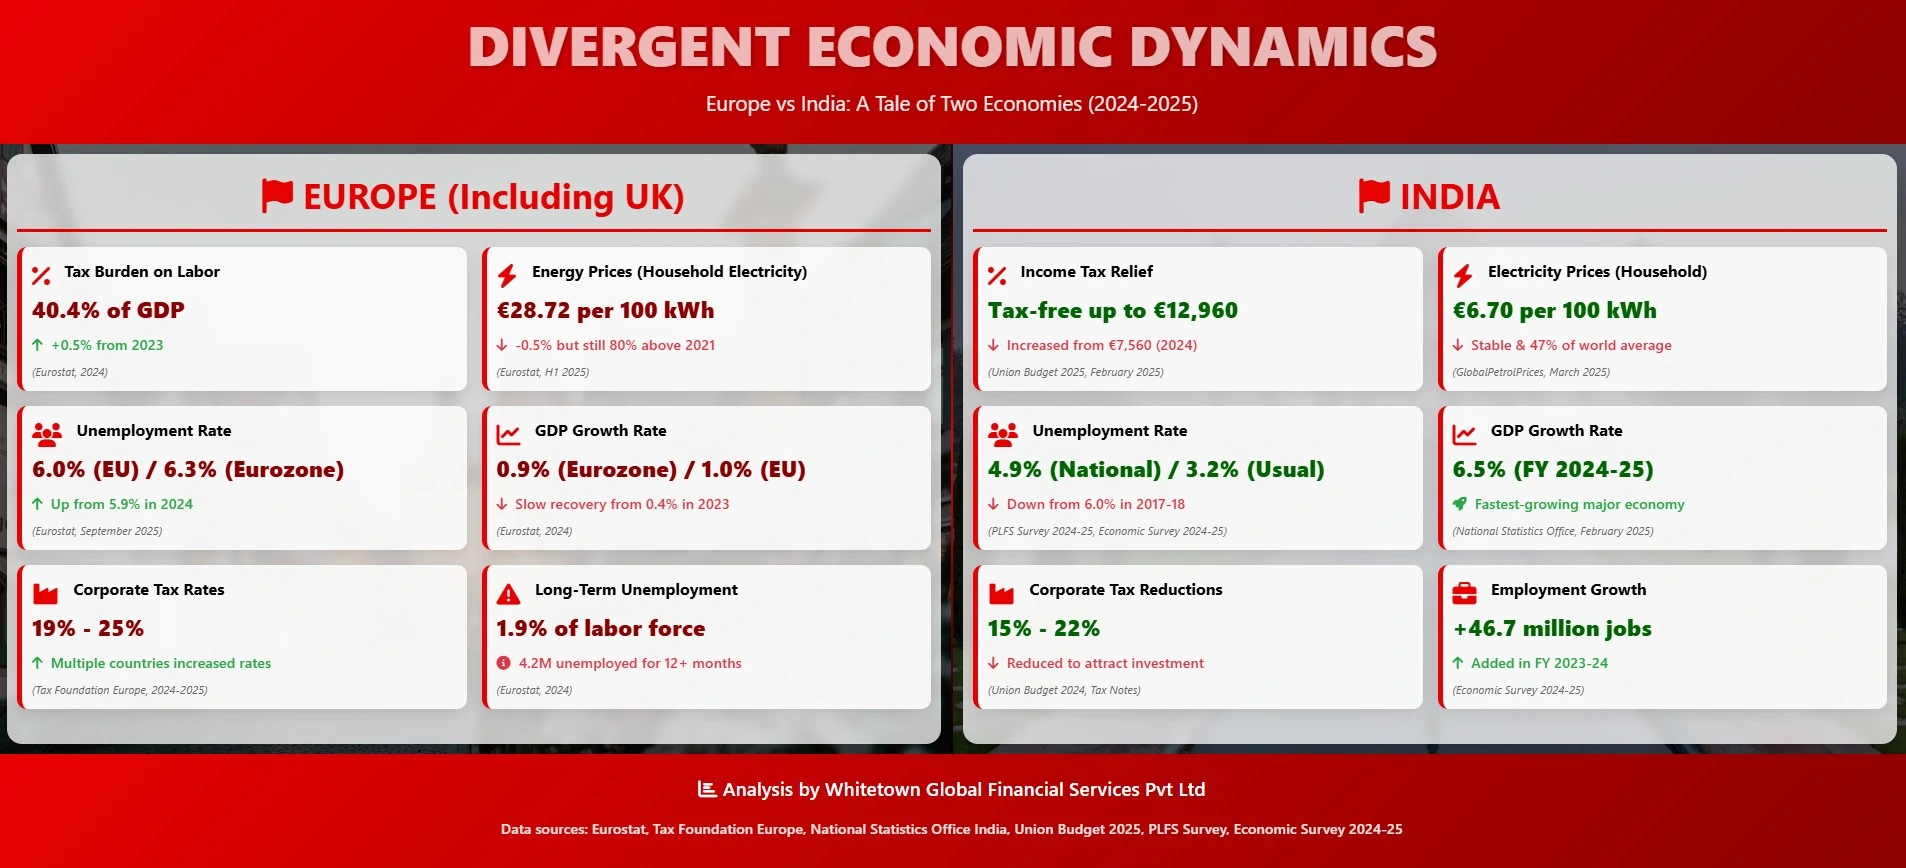
Eurozone GDP growth of 0.9% in 2024, with the broader EU at 1.0%, marks only a modest rebound from 0.4% in 2023, according to Eurostat. India, by contrast, is set to expand at 6.5% in FY 2024-25, keeping its status as the world’s fastest-growing major economy, National Statistics Office data show.
That nearly six‑percentage‑point gap anchors a simple trade: cyclicals and capital spending leverage Europe’s slow grind higher, while India offers structural growth across consumption, manufacturing and services. See the growth spread in the chart below.
Europe carries a structurally higher tax wedge. The tax burden on labor sits at 40.4% of GDP and edged higher by 0.5 percentage points in 2024, Eurostat data show. Corporate tax rates in major European economies cluster in the 19% to 25% band, with several governments nudging rates up to rebuild fiscal buffers.
India is moving the other way. The Union Budget has lifted effective relief at the bottom of the income ladder, making income effectively tax-free up to roughly €12,960, up from about €7,560 in 2024. Corporate tax rates for new manufacturing and many domestic companies have been cut into the 15%–22% range, explicitly designed to attract “China+1” supply chains and long-duration capital.
For global investors, the result is a sharper contrast in after-tax returns: Europe offers predictable but slimmer margins after higher labor and corporate levies, while India pushes headline returns higher but leaves execution risk firmly on management teams.
Energy remains the most visible cost shock. Household electricity prices in Europe average about €28.72 per 100 kWh, Eurostat estimates, only slightly lower than a year ago and still roughly 80% above pre-crisis 2021 levels.
Indian households pay roughly €6.70 per 100 kWh, or about 47% of the world average, according to GlobalPetrolPrices.com as of March 2025. That fourfold gap feeds straight into manufacturing bills and household disposable income, reinforcing India’s cost advantage in energy-intensive industries from cement to data centers.
While Europe accelerates its green transition and rebuilds gas storage, the near-term arithmetic still favors India for incremental megawatt-hours of industrial demand.
On the surface, labor markets look tight on both sides. Eurozone unemployment hovers around 6.3%, slightly above the EU-wide 6.0%, with long-term unemployment at 1.9% of the labor force, or about 4.2 million people out of work for more than a year.
India reports a national unemployment rate near 4.9%, with the “usual status” metric closer to 3.2%, based on the Periodic Labour Force Survey and the 2024-25 Economic Survey. More striking is the flow: the economy added about 46.7 million jobs in FY 2023-24 as formalization, infrastructure and services expansion combined.
The implication for investors is clear: Europe offers a skilled but aging workforce and political pressure to protect existing jobs, while India is still absorbing a young, expanding labor pool into new roles. Wage inflation, union dynamics and productivity trends will determine which market protects margins better over the next cycle.
For equity and debt markets, the spread in growth, tax and energy economics is already driving positioning. India screens as a high-growth, reform-led market with policy still oriented toward investment and employment. Europe, constrained by demographics and fiscal rules, leans more on regulatory stability, deeper capital markets and high-value exports.
That doesn’t make Europe uninvestable; it makes it selective. Investors are likely to favor globally exposed European leaders that can pass through higher costs, while using India as the core overweight for domestic-demand and manufacturing growth. As policy paths diverge, so will benchmarks: any sustained narrowing of the growth or cost gap will show up first in the charts, and then in the flows.